Logging Stations
Station Tab
The Monitor Log window is the first window you encounter when you start the
program, with Station the first tab.
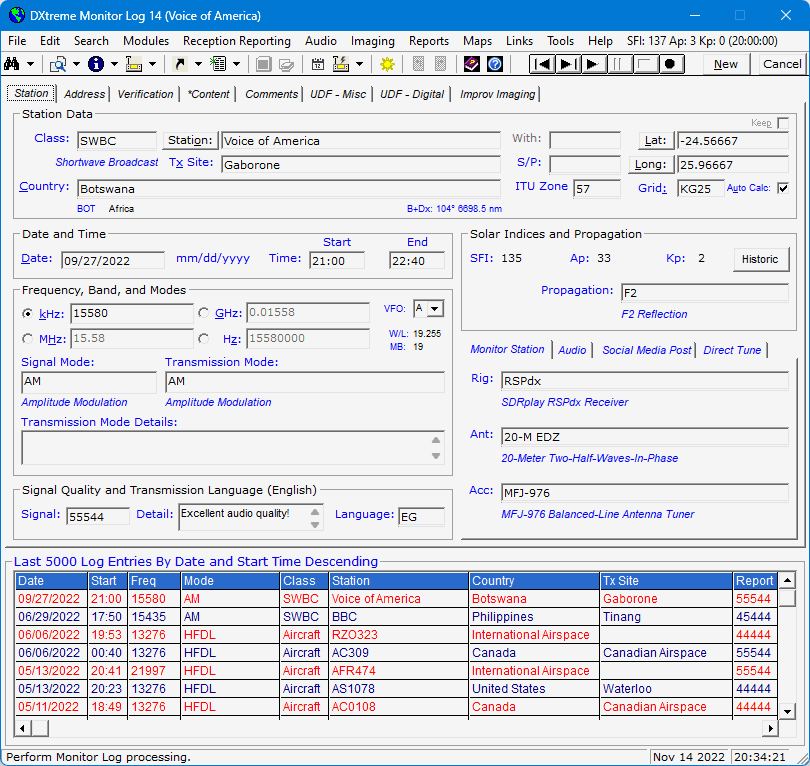
The Station tab lets you log introductory
information about the station you've heard. For example, you can enter the:
- Class of the station (BCB, SWBC, Aircraft, Ham, Ships, Utility, and so on).
- Name and location of the station: Tx Site, Country, Latitude,
Longitude, and Grid Square (automatically calculated from the coordinates specified).
- For ham stations, the call sign of the station the monitored
ham was in QSO With.
- Date and time of reception.
- Frequency of transmission.
- Signal mode your receiver is set to.
- Transmission mode transmitted by the station monitored.
- Transmission mode details when appropriate.
With a supported SDR application or Afreet Omni-Rig configured on your computer,
Monitor Log 14 obtains the frequency and signal mode from your receiver and displays
them in the Frequency, Band, and Modes area when you start a log entry.
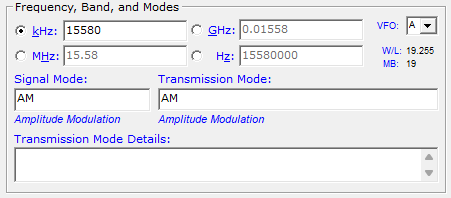
The kHz, MHz, GHz, and Hz option buttons let you
select a convenient unit of measure and the corresponding box lets you type/edit
the frequency. The boxes of deselected option buttons display converted
frequencies as appropriate and the remainder of the software uses kHz as the official
unit of measure. Monitor Log 14 remembers the last option button
selected.
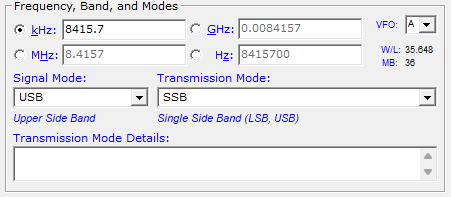
The software sets the Transmission Mode to a traditional mode based on the
signal mode provided by the rig control application. For example, if the rig
control application sets the Signal Mode to USB, the software sets the
Transmission Mode to SSB.
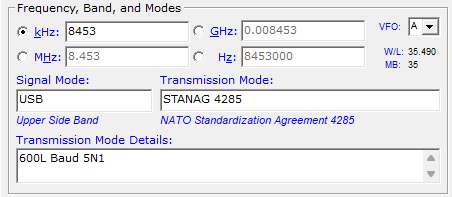
But say you've received a utility station transmitting in one of those exotic
digital modes, such as STANAG 4285, with your radio set to a
Signal Mode of USB. You select the digital mode received in the
Transmission Mode list box and type free-form information about the
received transmission mode — such as baud rate, bandwidth, etc. — in
the Transmission Mode Details box. This information will be important to
you and others, and should be included when you report reception.
The Transmission Modes module, which organizes and populates the
Transmission Mode field, can accommodate up to 30 characters per mode,
which is large enough to accept the official name of any mode active today —
like STANAG 4285 or MIL-STD-188-141A. A Signal Modes module manages signal
modes.
You can also use the Station tab to specify:
- Receiving equipment used to monitor the station.
- Signal quality of the transmission.
- Remarks about signal quality.
- Propagation mode of the transmission.
- Name of the file that contains a recorded audio clip of
the station.
- Announce your DX catches to social media sites. Refer to
"Reception Reporting - Social Media Posts " for more information.
eQSL.cc Nickname Default
After selecting Ham in the Class field and specifying call signs
in the Station and With fields, the default eQSL.cc Account Nickname is
displayed for your review after you tab out of the With field.
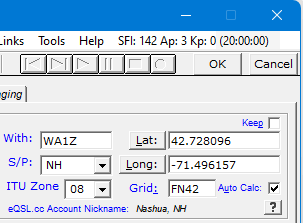
Clicking OK with the Monitor Log window on any tab sends the request to the
displayed account. You can, of course, visit the Verification/Report tab
to change the eQSL.cc nickname for the current log entry.
Note: The Amateur Radio section of this data sheet provides more information about
sending eQSL Requests. It also provides information about using the Update From eQSL.cc Inbox facility to process
eQSL.cc verifications and using the Batch Upload to eQSL.cc Outbox facility to batch-upload Ham-class log
entries (eQSL requests) to eQSL.cc.
Bearing and Distance Display
When the latitude and longitude of a station are known to Monitor Log 14,
short- and long-path bearings and short-path distance from your QTH to the station logged
appear in the B+Dx field on the Monitor Log
tab (in the unit of measure you specify in Preferences).
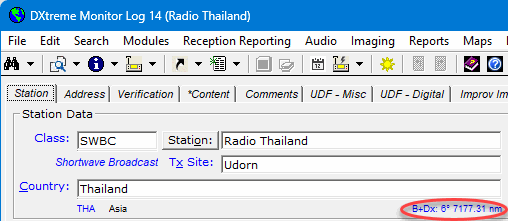
The short-path bearing appears continuously; the long-path bearing appears as a pop-up
when you mouse-over the field. If the coordinates of a station are not
known to Monitor Log 14, bearing and distance to the station's indicated country
appear.
Double-clicking the field runs a Ham CAP1 propagation prediction or
DX Atlas2 azimuth plot for the logged station (as specified in
Preferences).
Coordinate Acquisition
Monitor Log 14 uses station coordinates to display bearings, maps, and propagation information.
When specifying a country and tabbing out of the Country field, the program
obtains default coordinates from the Countries module,
which indicate the geographical center of the country.
Precise coordinates of the actual transmitter site can be obtained instead
by starting a log entry from an Aoki or FCC AM schedule in the
Schedule Checker. Unlike EiBi schedules, these schedules list the
latitudes and longitudes of most transmitter sites.

Another way to obtain the latitude and longitude of a transmitter site is to enter
the name of an ITU-registered transmitter site in the Tx Site field. You
can do so manually, or you can click the ITU code to look up the transmitter
site in the Transmitter Sites module.

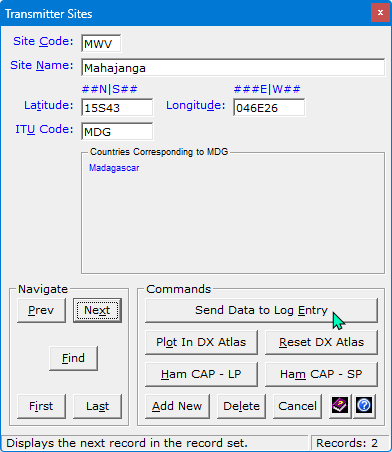
To lookup a site, you perform a Find operation on the Transmitter
Sites module based on the country passed, clicking Next to
navigate to the site you want. When you arrive at the desired site, you click
Send Data to Log Entry to update the Tx Site,
Latitude, and Longitude fields with the site's coordinates and, if
Auto Calc is selected, calculate and update the Grid square.
For BCB-class stations: When an FCC AM schedule has been imported into
the Schedule Checker, Monitor Log 14 queries the schedule data for QTH and
frequency information as you log BCB-class stations. The station call sign entered on the
Monitor Log window must match exactly the station call sign in the
imported FCC AM schedule.

Keep?
When you anticipate specifying much of the same information over several log entries, a
Keep? check box freezes the information in the following fields until
you clear the check box or click Cancel:
-
Class
-
Signal Mode
-
Transmission Mode
-
Date
-
Rig
-
Ant
-
Acc(essory)
-
Signal
-
Detail (Signal Quality)
-
Prop(agation)
-
Language
-
UDF 1 through 22
Address Tab
The Address tab lets you enter the postal and Internet addresses
of each station you've heard. You enter this information
once because Monitor Log 14 can recall it each time you
log the same station.
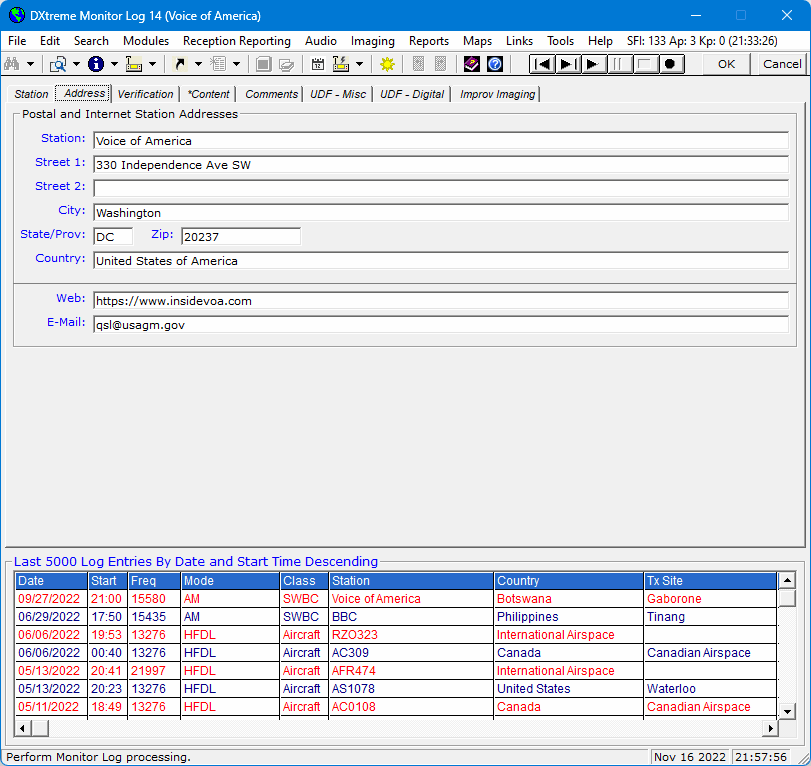
If desired, you can drag and drop, or copy and paste, address information from a Web-based
station lookup page.
When you subscribe to HamQTH.com,
QRZ XML Logbook Data, or
Buckmaster™ HamCall™, Monitor Log 14
fills the address fields automatically when you add a log entry for a
monitored Amateur Radio operator — if the information is provided by the
subscription service. If a QSL manager is defined in the service,
Monitor Log 14 enters the address of the QSL manager into these fields.
The address information appears in paper
reception reports, electronic reception reports, and address labels.
Clicking the Web caption on the tab displays the Web page of the station in
your specified browser; clicking the E-Mail caption invokes a
pre-addressed Message window in Microsoft Windows Live Mail,
Windows Mail, Outlook Express, Microsoft Office Outlook, or Mozilla® Thunderbird®
as configured in Preferences and supported by your version of Windows.
Verification Tab
Report
The Verification/Report tab lets you specify information
about your reception reports and eQSL.cc requests.
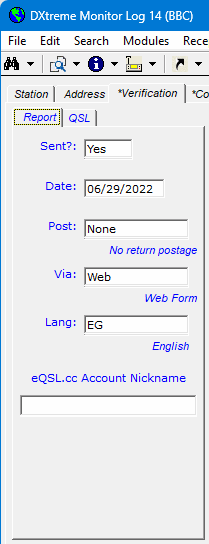
For Reception Reports, you can specify whether you've
sent a report. You can also specify the:
- Date you sent the report.
- Return postage you sent with the report.
- Method you used to send the report (air mail, surface mail, e-mail, etc.).
- Language of the report.
For eQSL.cc Requests to monitored Amateur Radio operators, you can change the
eQSL.cc Account Nickname through which the eQSL.cc request will be routed.
Monitor Log 14 sets the following fields automatically when the eQSL.cc request is accepted by the
eQSL.cc server:
- Date you sent the request.
- Return postage: None.
- Method: eQSL.cc.
- Language: English.
Monitor Log 14 also displays the response from the eQSL.cc server.
Note: The Amateur Radio section of this data sheet provides more information about
sending eQSL Requests. It also provides information about using the Update From eQSL.cc Inbox facility to process
eQSL.cc verifications and using the Batch Upload to eQSL.cc Outbox facility to batch-upload Ham-class log
entries (eQSL requests) to eQSL.cc. In addition, the Update/Import section of this data sheet
provides information about using the Import Log From ADIF facility to import ADIF-formatted log
entries from all monitoring activities — both ham and non-ham — into your database.
QSL
The Verification/QSL tab lets you specify information
about your QSLs received.
For QSLs (paper or electronic), you can specify whether you've received a
QSL. If you have, you can scan, capture, or import it and specify the:
- Date you received the QSL.
- Method the station used to send the QSL to you (air mail, surface mail,
e-mail, and so on).
- Signer of the QSL.
- Name of the file that contains an image of the QSL.
The Verification/QSL tab also lets you preview the
scanned, captured, or imported QSL.
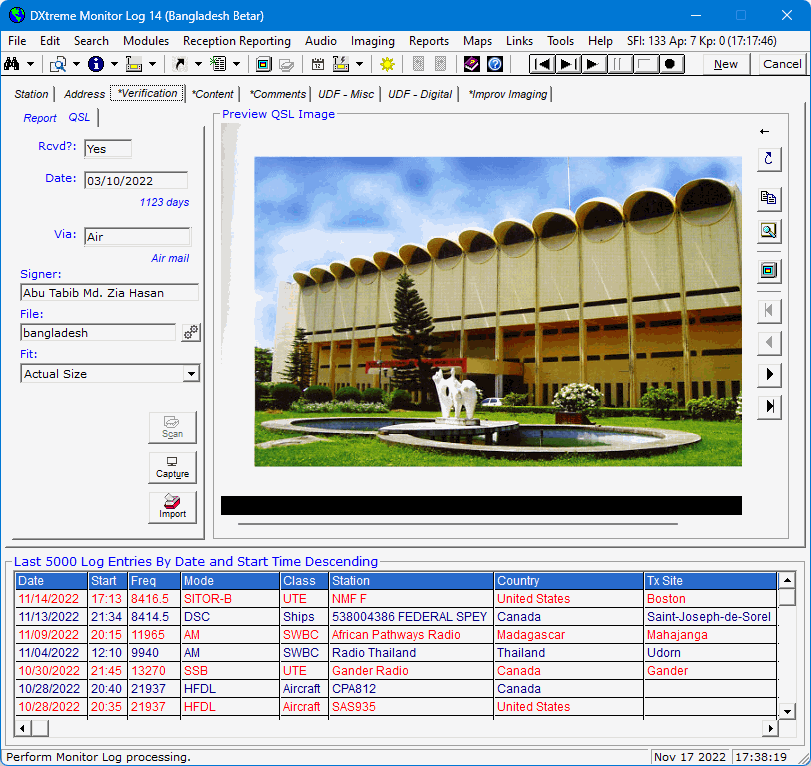
And the Preview QSL Image display shows QSL images automatically whenever you display a
verified log entry. It includes:
- A Fit box for applying fit-to options to the display
- And command buttons for:
- Refreshing QSL images when necessary after scrolling
- Copying QSL images to the Clipboard
- Magnifying images
- Displaying images full size in the re-sizeable QSL Imaging application
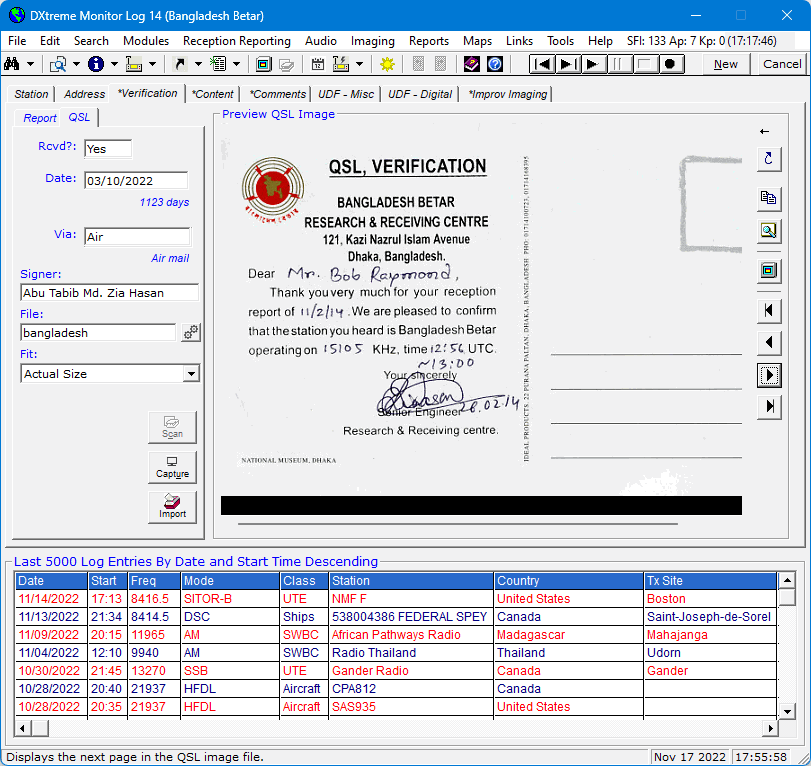
- Navigating multipage images within the Preview QSL Image display;
this screenshot shows page 2 of the QSL:
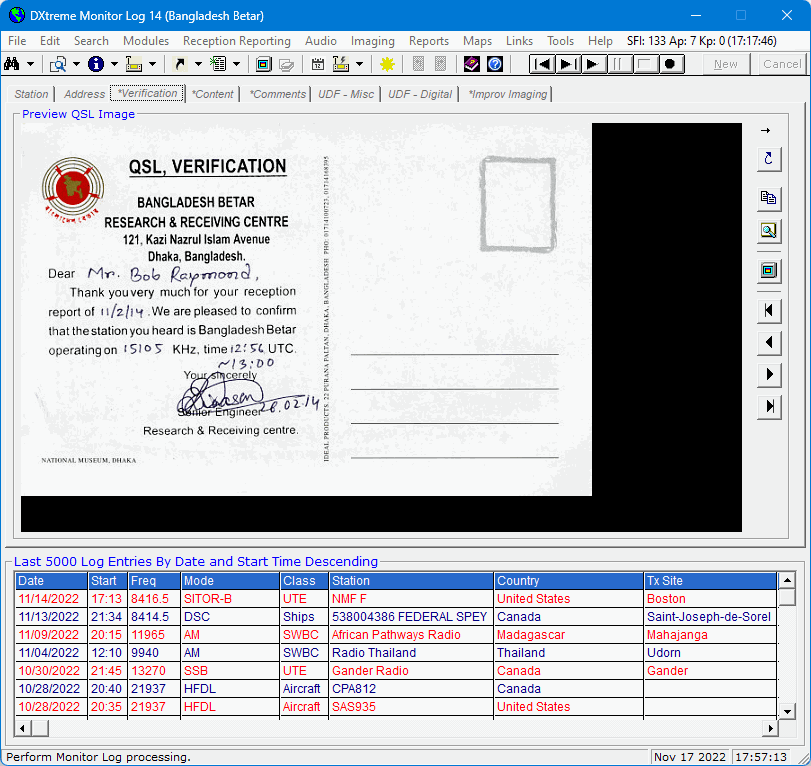
An arrow button at the top-right of the viewing area lets you expand
(and contract) the width of the display, so you can see more of your larger QSLs.
More on QSL Imaging later.
Content Tabs
The Content Tabs let you describe the content you monitored.
When you click or "Tab" to the Content tab in the top row of
tabs on the Monitor Log window, focus is applied to the Details box, the
Start and End boxes populate automatically with the start and end
times specified on the Station tab, and Content Tab 1 is relabeled
with those same start and end times.
Within the Details box, you begin typing your content details.
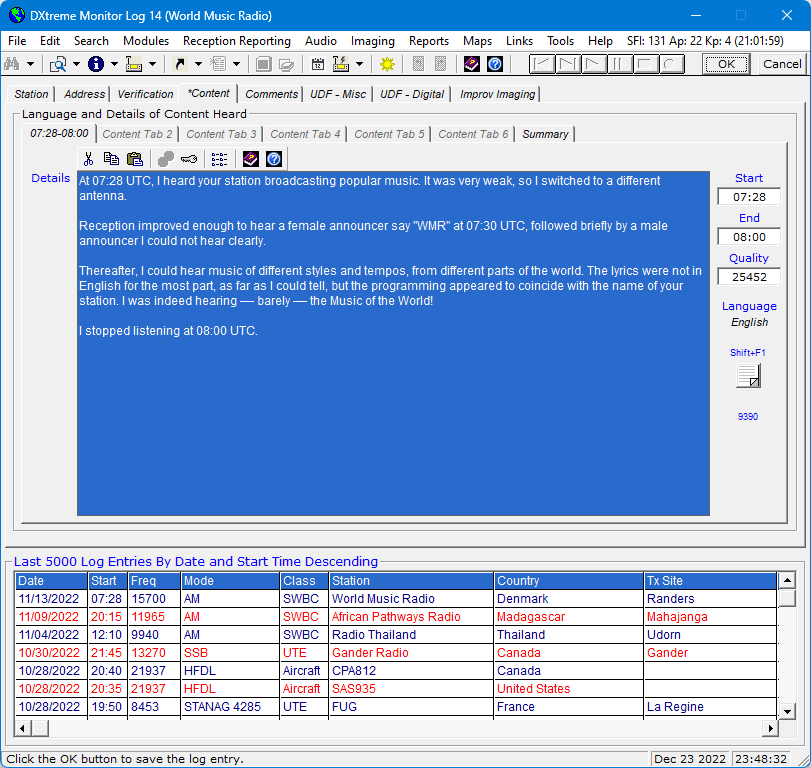
If you want, you can type details of an entire transmission on just one Content Tab,
which is what we did for our African Pathways Radio log entry above.
Or you can spread your content details across two or more tabs (as shown below), which produces distinct
rows of content details — per time interval — on your reception reports. You can type up to 10000
characters per Details box. The number of characters remaining displays at the lower
right within each tab. For this data sheet example, you'll spread your content details across
two tabs.
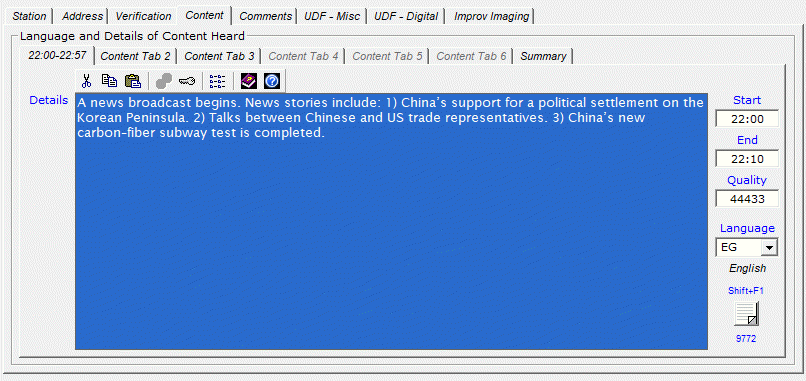
When you have finished typing content details for Content Tab 1, you click or "Tab" to the
End box and type the end time for the details you wrote (say, 22:10), Tab to the
Quality box and accept or change the signal quality for the time interval.
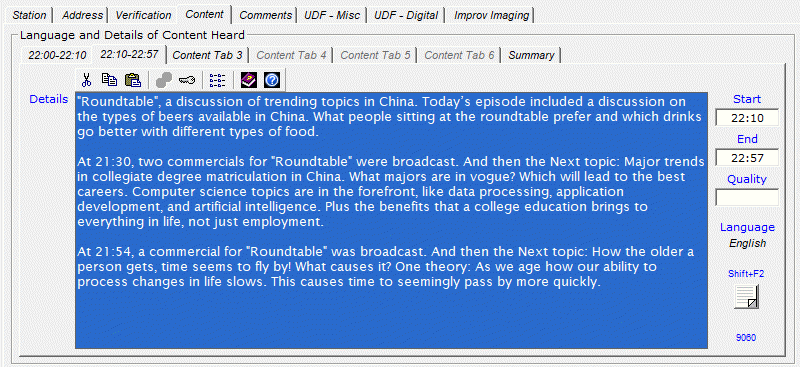
Next you click Content Tab 2 (or if you prefer, "Tab" repeatedly until Content Tab 1 has the
focus again and press the Right Arrow on your keyboard to move to Content Tab 2).
The cursor is now in the next Details box and the following events occur:
- Content Tab 1 is now labeled with the Start
time and the modified End time as specified within its tab.
- The Start box displays the end time from
Content Tab 1.
- The End box displays the end time specified on the
Station tab.
- Content Tab 2 is now labeled with the Start
and End times specified within its tab.
Within the Details box, you type content details for the next program.
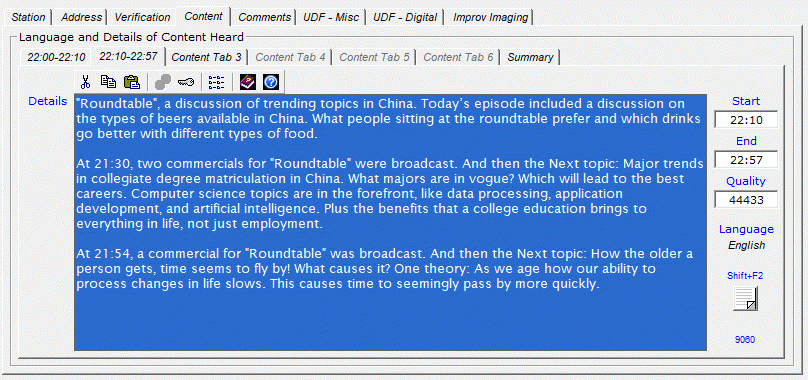
When you have finished typing details for Content Tab 2, you click or "Tab"
to the Quality box and accept or change the signal quality for this time interval.
(Of course, if you were to write content details on another tab, you would
also adjust the End Time as you did in Content Tab 1.)
To generate or compose a summary, click or "Tab" to Summary and double-click
the Generate hyperlink. The software inserts into the Summary field keywords
summarizing the content you wrote in the Details fields of the previous Content Tabs.
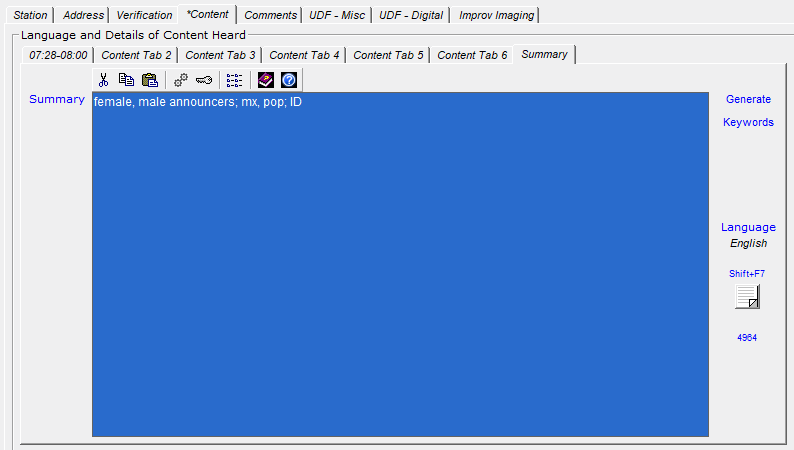
It is likely you'll want to edit the summarized version. You can generate or type up to 5000
characters in the Summary field. The number of characters remaining displays
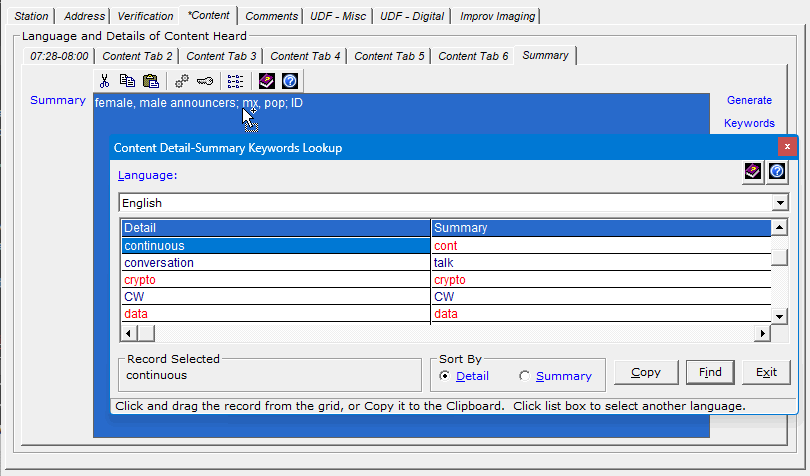
at the lower right. Also, if desired, you can double-click the Keywords
hyperlink to drag-and-drop (or copy and paste) into the Summary field detail or
summary keywords from the Content Detail-Summary Keywords Lookup window.
The text in the Summary field populates the
[content-summary]
log variable, which can be used in scripts of any kind (but especially in those used to
share log entries) to provide summarized versions of the content heard.
Speaking of log variables, there are dozens from fields throughout the
software, which you can use when sharing log entry data or creating
Reception, Performance, and Stations reports (log variables
such as Signal Modes, Transmission Modes, Transmission Mode Details, etc.).
When you're ready, click OK to save your log entry.
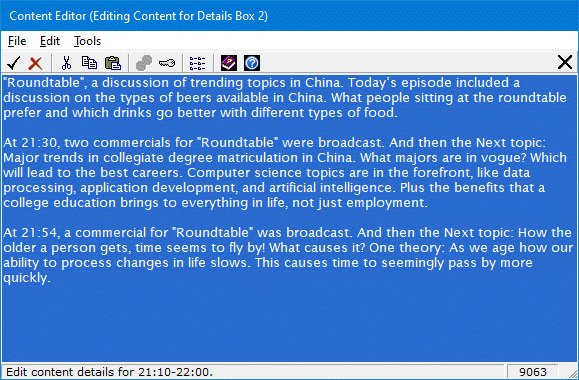
Note: If you prefer to write content details on the resizeable
Content Editor window, you can click the button at the lower right of any
selected Content tab.

The Content Editor window appears.
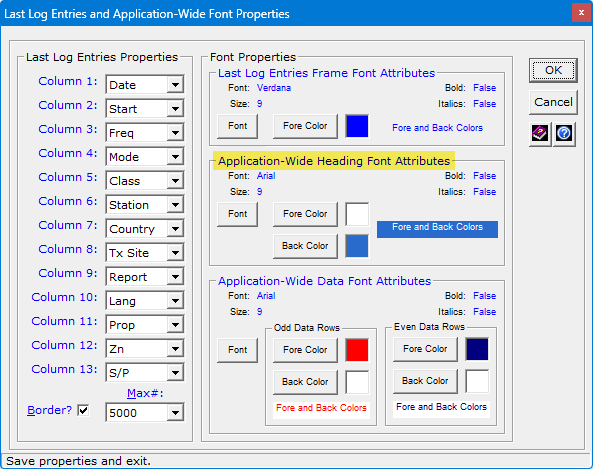
If desired, you can change the look and feel of the Details and Summary fields and
the Content Editor by clicking the Option button in one of the toolbars (highlighted
in yellow in the following screen shot).

Then set the fields in the Application-Wide Heading Font Attributes area as desired.
Comments Tab
The Comments tab has a single field that lets you enter additional information
about each log entry. The Comments field can accommodate up
to 10000 characters.
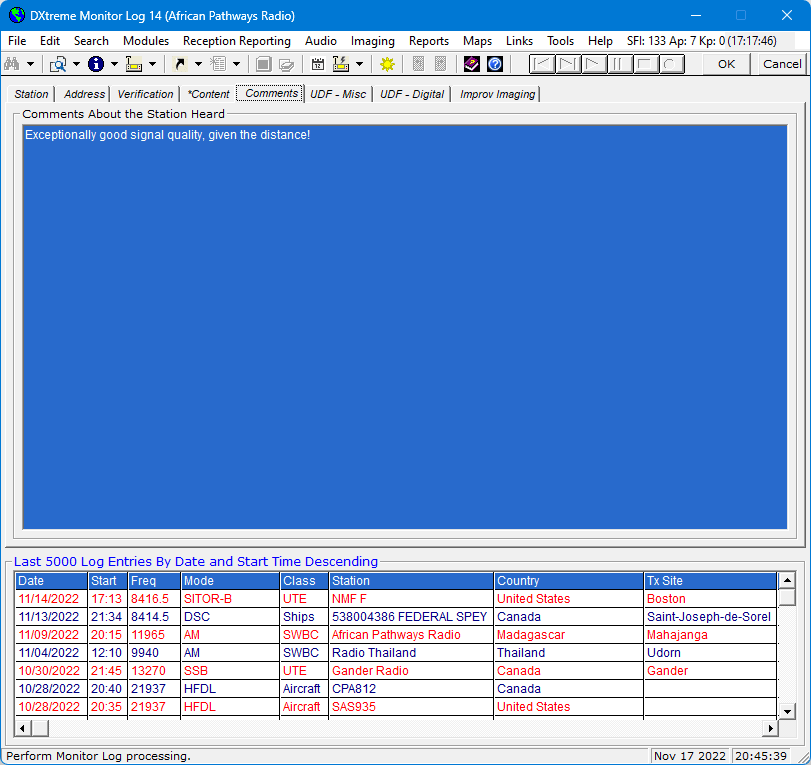
Changes you make to header font attributes on the multi-functional Last Log Entries
And Application-Wide Font Properties window (accessible from the
Last Log Entries) grid are applied to Comments. You can change
foreground and background colors and fonts and font sizes, if desired, to
increase readability.
User Defined Fields Tabs 1 and 2
Each User Defined Fields tab has 11 fields you can define and use
to enter and track information important to you.
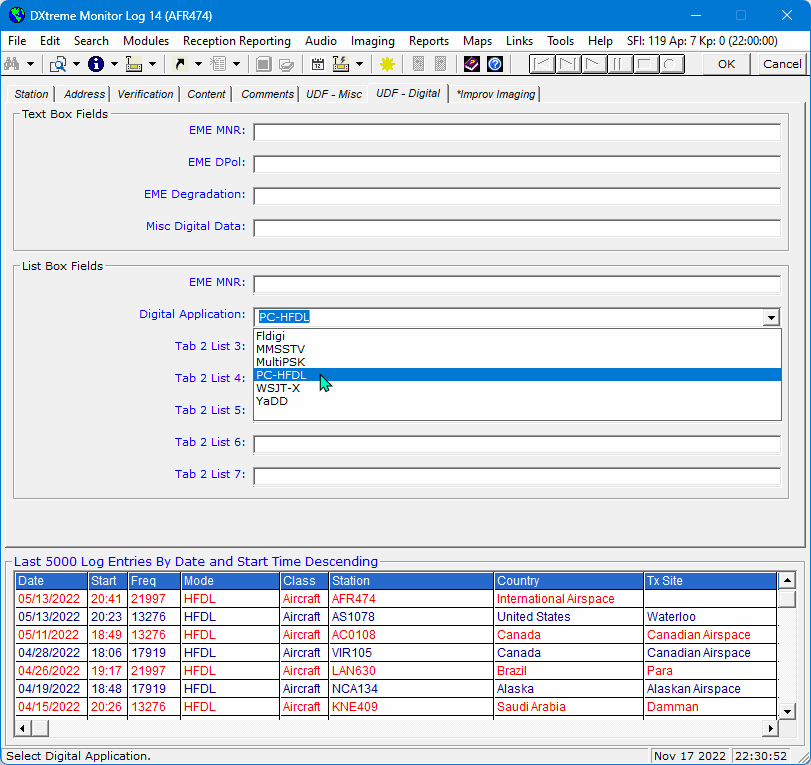
There are two kinds of user defined fields (UDFs): Text Box Fields and
List Box Fields.
- Text Box Fields — Four text box fields on each tab let you
type the information you desire. Each field can accommodate up
to 100 characters.
- List Box Fields — Seven list box fields on each tab let you
select the information you desire from a list of
items you defined earlier.
You define UDFs on the Preferences window (described
later). You can also label the caption of each UDF tab.
Defining UDFs involves:
- Labeling each field.
- Entering the list items available for selection in each list box field.
For example, you could define and use UDFs
this way:
- Text Box UDF — Specify "Parallel Frequency" as the label in
Preferences. Then on the Monitor Log window, type the station's
parallel frequency into the Parallel Frequency box. When
you run a report, you can track parallel frequencies.
- List Box UDF — Specify "Digital Application" as the
label in Preferences and then define a list of the digital applications
you use. On the Monitor Log window,
select the digital application you used to monitor the station. When
you run a report, you can track specific digital applications.
When you redefine User Defined Fields (as you inevitably will, from time to time), you can
replace old UDF data in your log with new UDF data using the UDF Data Replacement
facilities, accessible from the Edit menu of the
Monitor Log window.
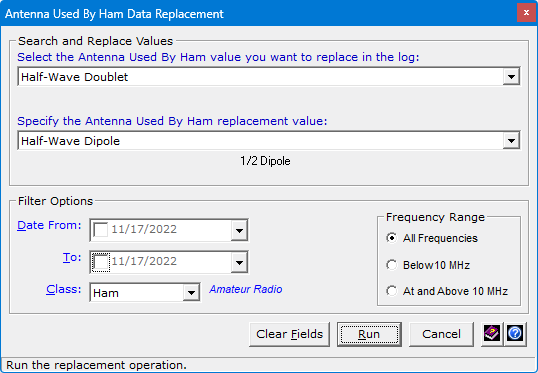
The window above shows replacing Doublet antenna entries with the more traditional
Dipole.
Improv Imaging Tab
The Improv Imaging tab lets you associate ad hoc images with log entries.
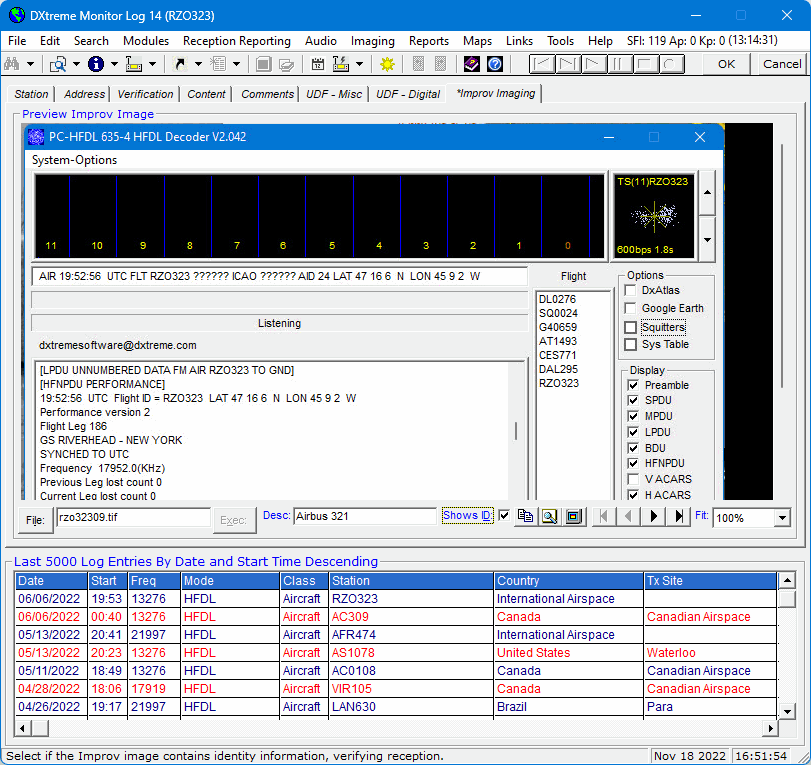
Shown: PC-HFDL by Charles Brain, G4GUO. Visit
http://www.chbrain.dircon.co.uk for more information.
The Improv image associated above is a screenshot of the PC-HFDL application
during reception of Flight RZO323, an Airbus 321 jet in International Airspace
flying over Grid Square GN77, heading west toward Labrador.
Other images you can associate with log entries can include signals on a
spectrum analyzer or waterfall, screen captures of other digital applications,
and more. Anything you desire!
An asterisk appears in the Improv Imaging tab when an
Improv image is associated with a displayed log entry.
More on Improv Imaging later.
Last Log Entries Grid
If desired, you can display a
colorful
grid on the Monitor Log window
that shows up to 5000 of the most recent log entries.
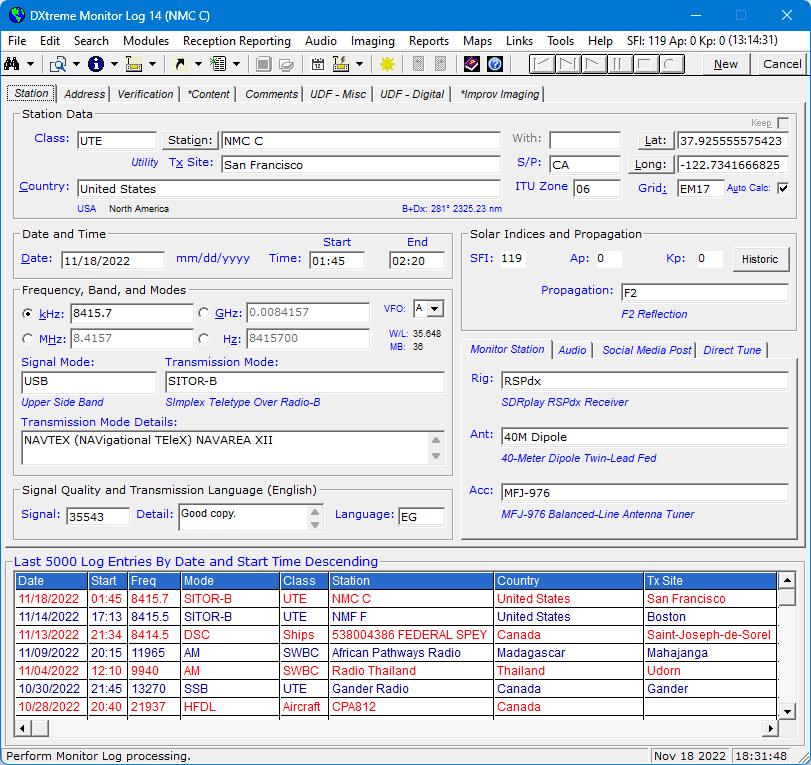
Double-clicking a row in the grid displays its log entry in the
Monitor Log window, and right-clicking the grid
brings up a shortcut menu that lets you sort records and access other functions.
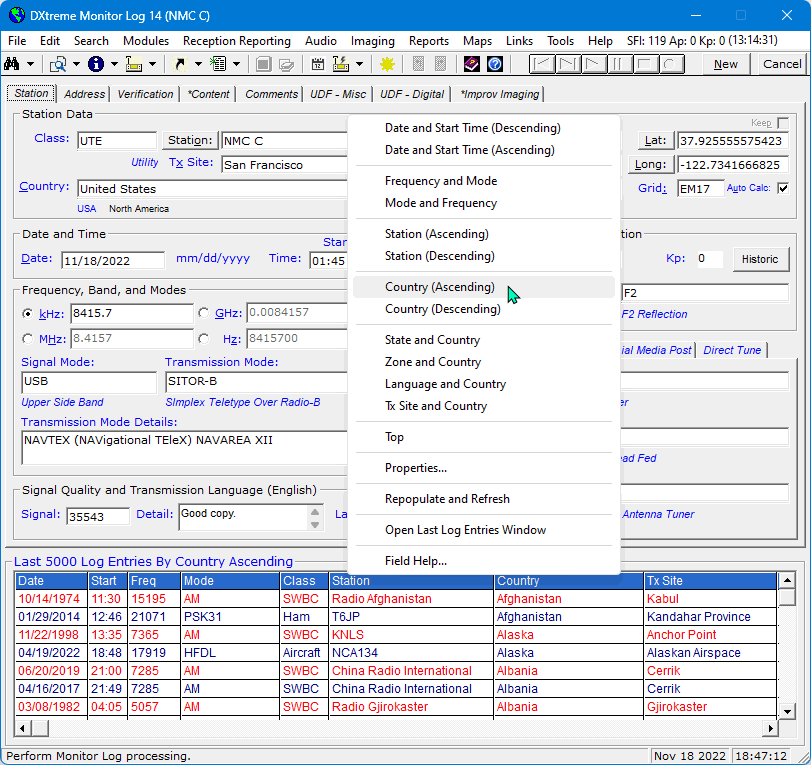
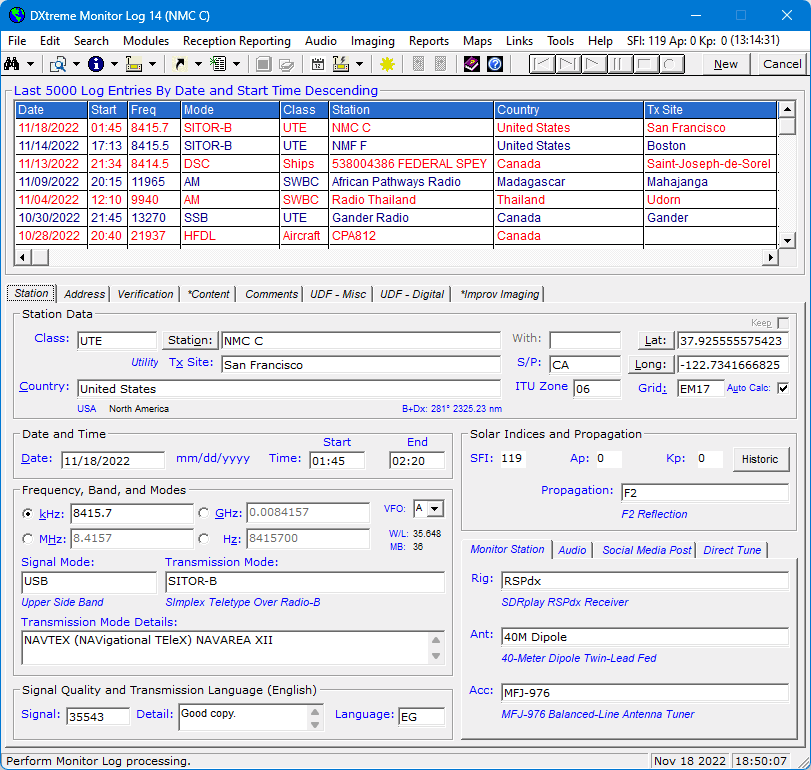
The grid can be placed above or below the tabbed set of fields on the
Monitor Log window. You can also resize the grid columns and
scroll horizontally to columns that do not appear initially.
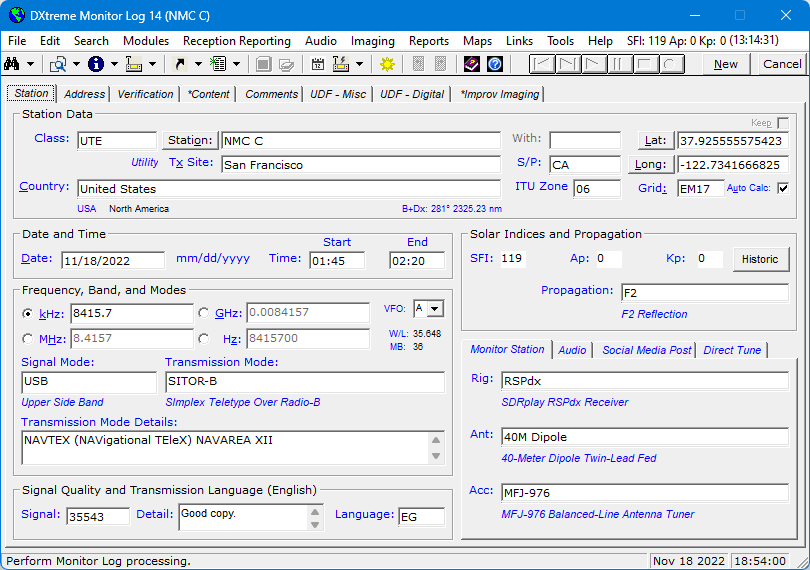
You can make the grid disappear and reappear by re-sizing the Monitor Log window.
Last Log Entries Window
Because the names of stations and NASWA countries can be quite long, you can
display a re-sizable Last Log Entries window.
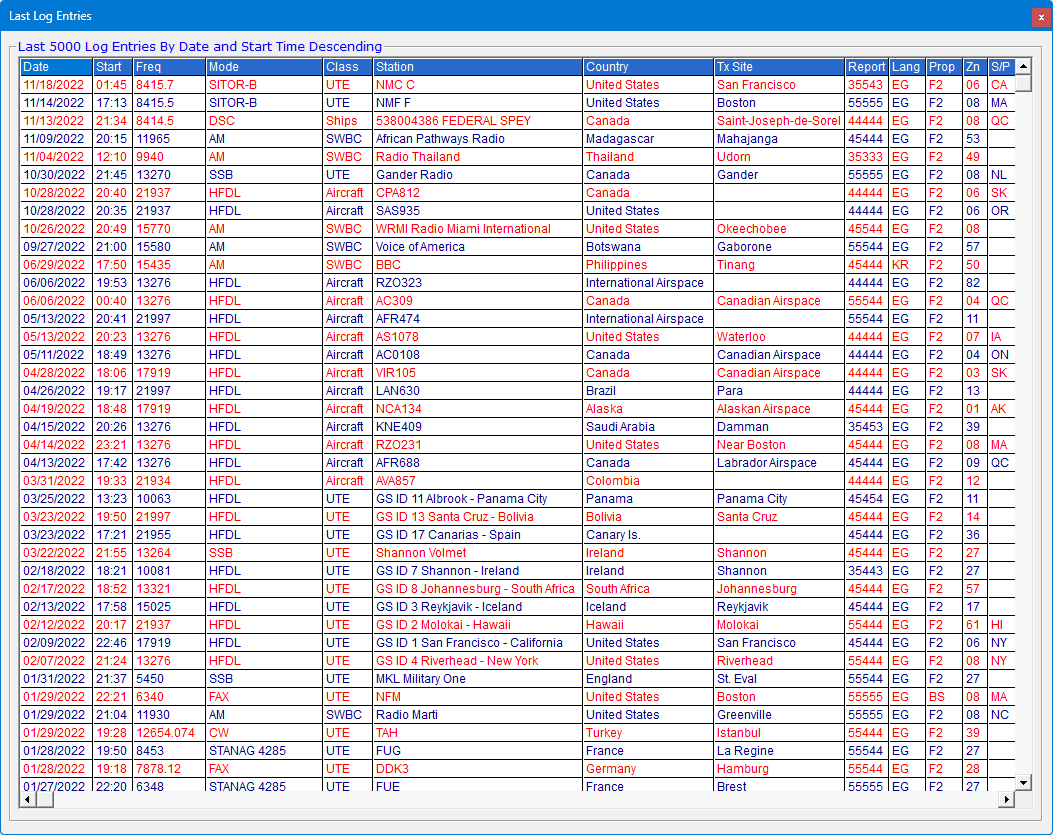
This window has all of the functions of the Last Log Entries grid
and can be much wider and longer. You can display the grid and the window together or separately.
Properties
A Properties dialog box can be invoked via the
shortcut menu.
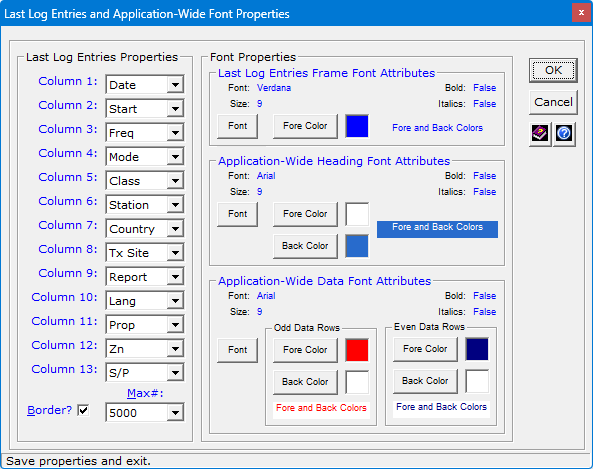
Enabling you to:
Fields and Maintenance Modules
Most fields on the Monitor Log window are drop-down
list box fields that make entering consistent data easy. These
fields are populated with list items you maintain
in Monitor Log 14's maintenance modules (described later).
Menu Bar and Toolbar
The menu bar lets you access the other functions of Monitor Log 14,
such as the Schedule Checker, optional Band Master, Search,
Accessing Information From the File System, Sharing Log Entry Data with Blogs and
Clubs, Reception Reporting, Audio Processing, Imaging, Performance
and Stations Reports, Maps — including Ham CAP1 propagation
predictions and DX Atlas2 azimuth plots — Preferences,
Accessing Procedural and Field Help, and more.
The toolbar lets you quickly and conveniently access the functions used most often.
Web Search Functions
Station
When you add, modify, or display a log entry, a Station button appears
over the text box label of the same name on the Monitor Log window,
provided the adjacent text box is populated. Clicking the Station button
displays a context menu that provides Web search functions that are germane to the
station name.
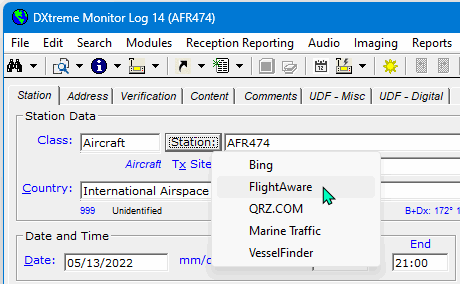
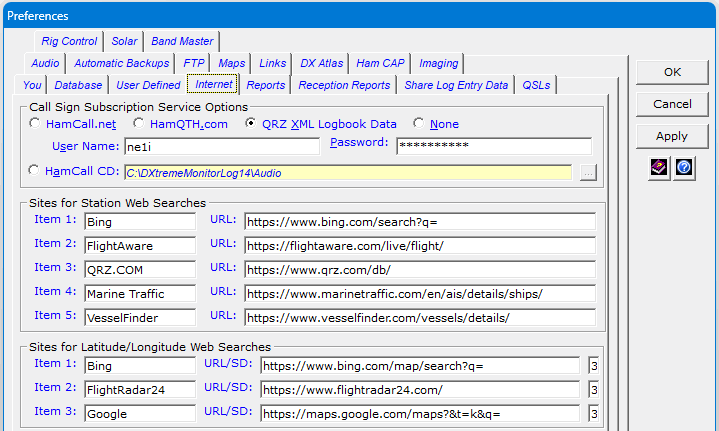
Default Web search functions are provided, but can be changed by
you in Preferences. The Web sites chosen must accept the station name as a
URL argument.
Lat/Long
When you add, modify, or display a log entry, Lat and Long
buttons appear over the text box labels of the same name on the Monitor Log
window, provided the adjacent text boxes are populated. Clicking the
Lat and Long buttons display a context menu that provides Web
search functions that are germane to geographic coordinates.
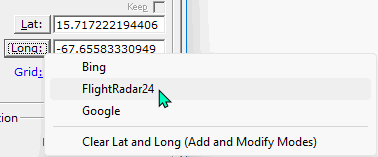
Default Web search functions are provided (see above), but can be changed by
you in Preferences. The Web sites chosen must accept decimal coordinates as
URL arguments.
CQ or ITU Zones
A Preferences setting lets you choose whether to track zones.
And whether to track CQ or ITU zones.

CQ and ITU zones are present in the Countries module. Automatic CQ or ITU zone selection
occurs when you add a log entry for a country that has one zone assigned. If multiple
zones are assigned to a country, the range of possible zones appears in the microhelp panel on the
Monitor Log window to guide your selection.
CQ and ITU Zone maps are available by default in the Maps menu.
Import Log From ADIF
The Update/Import section of this data sheet provides information about using the
Import Log From ADIF facility to import ADIF-formatted log entries from all monitoring activities
— both ham and non-ham — into your database.
1 — If you have a copy of Afreet Ham CAP and Afreet Omni-Rig (both free).
2 — Software license for Afreet DX Atlas is required only if you want to use DX Atlas.
3 — Requires an Internet connection, and the information must be available from NOAA.
Note: You can obtain Afreet licenses from Afreet Software, Inc. at
http://www.dxatlas.com.
|